Utility in Selection
Introduction
The use of assessment techniques hasn’t been studied as much as in selection. In part, that’s because we may continue to nurture the idea of a silver bullet, these magical characteristics that will inform if a candidate can be successful. Reality is a bit more complex and involves the environment as much as the persons themselves. Decades of designing job descriptions and trying to find the best-fit candidates mostly led to deceitful conclusions that those characteristics are indeed magic and often unrealistic. There are a few aspects to keep in view when using assessment techniques that are reviewed here.
Utility’s Standard Approach
The standard approach to an assessment technique’s utility in selection reflects the general appreciation and common sense that if you can predict a person’s performance by a characteristic, then this characteristic accounts for its utility. For example, if a person has good results in a math test, and that person indeed performs well in math in the future, then this test has a utility.. By looking at a large number of people and using statistics, the way to evaluate an assessment technique’s utility is to analyze the relationship between what the technique measures and a professional criterion, such as turnover, production, satisfaction, etc., and to estimate the improvement that can be attributed to the assessment technique.
If the first one probably leads to the second compared to a random decision, then the first one, the characteristic assessed by the technique, can account for its utility in improving performance.
The formula used for this calculation is called the standard error of measurement. The ratio Sqrt (1-RxR), where R, the validity or correlation coefficient, indicates the size of the error that would result from a random decision. With a correlation of 0.5, the ratio is 87%, which indicates that the use of the assessment technique would reduce a random decision by approximately 13%. A correlation of 0.5 is rare, though, or it may correspond to a selection process that happened randomly. Frequent values found with assessment techniques are 0.2 or 0.3, which reduces the haphazardness by 2% or 5%. Those values are nevertheless generally considered good enough for an assessment technique to be included in an automated selection procedure.
Are attractive men and women selling better than others? Do people with specific traits excel in certain jobs? How much can success be attributed to such leadership styles compared to others? How does attending such a college improve performance? Over the years, the standard approach to assessment techniques' utility has helped challenge and disprove the most common ideas. What other variables should we look at to better predict and improve performance?
Common sense, regardless of intelligence, is not enough to predict and improve individual performance. Many characteristics can be assessed and understood, not only on a personal level but also within their environment. Assessment techniques provide information that, even if not used in an automated mass selection process, contribute to a better understanding of people, including those who don’t meet certain requirements. They can also help individuals and their environment grow together so that the requirements can be met sooner or even exceeded.
Mass Selection
When recruiting a large number of candidates for the same position, or mass recruitments, even more than in other situations, criteria other than the standard error of measurement and correlation coefficient must be considered, such as the percentage of people to be discriminated against and the economic value at stake.
Here, utility is addressed through decision theories. Originally developed by Wald for quality control in the industrial sector, those methods were later adapted by Cronbach and Gleser, taking into consideration the a priori acceptance or rejection of candidates, ultimately leading to success or failure.
Utility Based on Pass Percentage
The first utility tables used in selection were established by Taylor and Russell to estimate the net gain in recruitment precision. In addition to the validity coefficient of the assessment technique, this model includes the proportion of participants who should pass with and without answering the assessment technique.
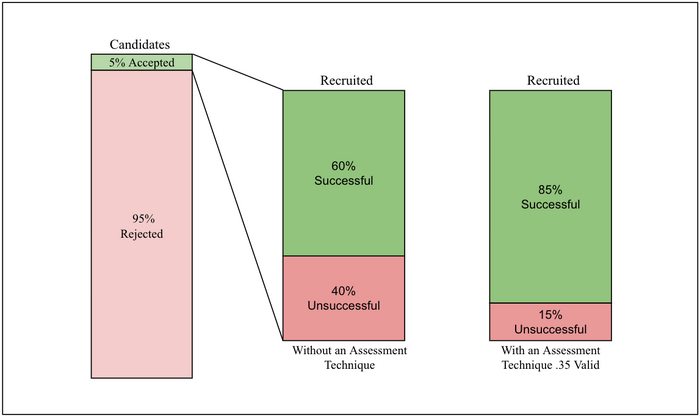
These tables show, for example, that when 5% of candidates are selected for a job with an assessment technique whose validity is 0.35 and in a situation where not using the assessment technique gives 60% success, using the assessment technique improves the success rate by 25%, from 60% to 85%.
Variation in Productivity
Brogden demonstrated that the improvement in employee performance is directly proportional to the validity of the assessment technique, not by focusing on the percentage of people whose performance exceeds a minimum, but by examining the productivity of the selected employees. For example, the improvement resulting from the use of an assessment technique whose validity is 0.5 is 50%. The formula developed by Brogden is as follows:
- Δr = Variation in validity represented by the predictor/criterion correlation coefficient of two assessment techniques implemented. If the reference technique is random selection, whose validity (and correlation coefficient) is zero, then the gain in utility is directly proportional to the validity.
- SD = Standard deviation of staff productivity. Productivity can be measured in different ways, but two methods are typically used: either by measuring the production in monetary value or by measuring the production as a percentage of the average value being produced.
- Z = Average score of selected applicants, in standard scores for the predictor, compared to all applicants. When all applicants are selected, Z=1. The lower the selection ratio, the higher the value of Z.
Other tables were proposed by Naylor & Shine, taking into account the variance of the performance measured by the ratio between the best and the worst employees' production.
Variants of Brogden's formula exist that allow other parameters to be included, such as employment duration at the company or even the cost of the assessment technique being used.
Ghiselli and Brown simplified the use of utility tables by presenting them in the form of diagrams. Brogden's work was taken up by Schmidt et al., who calculated the financial gains in recruitments for public administrations. The research undertaken by this team included criteria other than economic criteria in hiring decision models, such as people's preferences, values, personality, organizational goals, social values, etc. Considering productivity as being measured by output in monetary value, research shows that the standard deviation of productivity (SDP) is at least 40% of the average salary in the job.
For example, if the average annual salary for a given position is $80,000. Then the value of SDP is at least $32,000. If the performance follows a normal law, the person at 84th percentile produces $32,000 more than the one who is at the average (at 50th percentile). Between the one who is below the average (the one who is at the 16th percentile) and the one above the average (the one at the 84th percentile), the difference per year is $64,000. Considering productivity as a percentage of the average value being produced, studies show that the standard deviation of productivity SDP varies with the level of the position. In these calculations, the value produced by each person is divided by the average value produced by all the people at the same level, multiplied by one hundred.
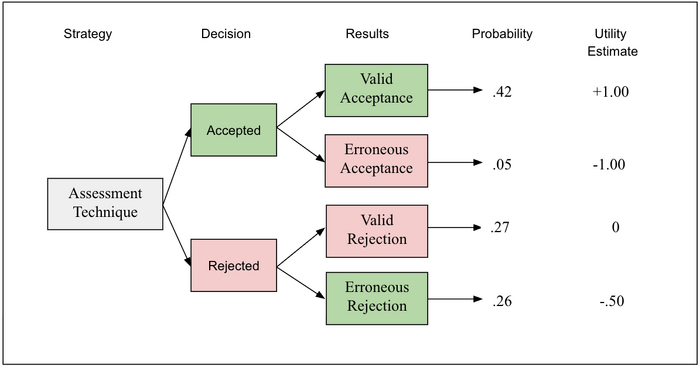
For unskilled positions, the value of SDP is 19%, for skilled positions, the value is 32% and for managerial and professional positions, the value is 48%. (Hunter et al., 1990). These numbers result from an average of all available studies that measured the value produced for different jobs. Utility and False Rejections The following diagram illustrates a strategic decision in which a single assessment technique is administered to a group of applicants to accept or reject their application based on the assessment technique’s results. The objective is to maximize the expected utilities across all possibilities. This simple technique to measure the utility of an assessment technique was developed by Boudreau, extending on the previously mentioned work of Schmidt and Hunter.
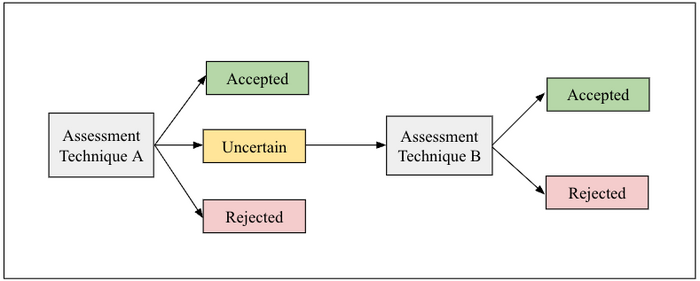
In the above example, the cost of the assessment technique is estimated at 1 on the utility scale. The overall utility of the assessment technique is calculated by multiplying the probability of each outcome by its utility, then adding these products for the four outcomes and subtracting the cost of the assessment technique. In the case illustrated below, the expected utility EU = (.42)(1.00) + (.05)(-1.00) + (.27)(0) + (.26)(-.50) - .10 = +.14. This model suggests that an assessment technique used in selection that can only provide low predictive validity, which is generally the case, gains nothing by being longer and more expensive to administer. In reality, the selection process happens in several steps according to the diagram below, where two techniques, such as biodata, an interview, or a personality assessment, are used one after the other.
In mass recruitments, when several assessment techniques are used whose criterion values are estimated to be known, their results can then be combined using multiple regression equations. Various techniques have been developed to account for correlations between multiple assessment techniques and to enhance the predictive power of the equation from one sample to another, based on error probabilities.
Cutoff Scores
Multiple cutoff scores need to be used to avoid attenuating some critical and highly rated characteristics with others that are weak and unnecessary. For instance, a significant deficiency in one skill may not be visible if the person is performing well in other skills.
If the deficiency occurs in a skill that is critical for a particular position, then the person has every chance of failing. This situation can be avoided by identifying the critical skills that are needed for a position and applying the multiple cutoff method to these skills.
For the majority of assessment techniques, it is therefore preferable to use the raw scores rather than to use multiple regressions.
One-person Selection
When the selection process for a job is for one individual rather than many, as is the case for executives, the assessment of candidates includes several assessors and several techniques. Multiple variables are at play. Utility equations used in mass recruitment have no applicability in this case. Ultimately, the assessors’ analysis and regressions performed by them on multiple characteristics become the most effective process.
Particularly in this case, the validity of a technique cannot be confused with the validity of the selection decision, which relies on a combination of characteristics assessed by various techniques and assessors.
In any case, a selection decision is based on an inference about the future. Individual characteristics and future professional behaviors must be taken into consideration, but also the criteria that will make it possible to judge the quality of the decision or the way in which the person will be evaluated. It is, therefore, crucial to consider the criteria by which the person will be assessed in the future by management or a board in the case of executives.
Moderating Variables
Importantly, utility calculations in selection need to be moderated by variables such as the candidate's motivation and interest. When candidates are interested and highly motivated by a job, they will show strong correlations between aptitude tests, for example, and job performance. When they are not motivated to answer an assessment, one cannot expect good results from them.
The utility of an assessment technique in selection is not only affected by its intrinsic characteristics, of which the validity coefficient is a part, but also by the environment that allows candidates to adapt and develop those characteristics.
In an automated selection process of a large number of candidates, the concept of a moderating variable generally has little value. More sophisticated statistics and analytical frameworks are then required to study the impact of moderators.


