Scales and Intensity: Difference between revisions
m (→GRI Scale) |
|||
| (18 intermediate revisions by the same user not shown) | |||
| Line 1: | Line 1: | ||
=Introduction= | |||
This article presents the normative and ipsative approaches used for measuring and comparing individual dimensions measured by assessment techniques. It also discusses the pros and cons of using decile, value-based, typology, and standard scales. The quality of the scale is critical for having a clear appreciation of a dimension’s intensity. It has important repercussions on the quality of the information being measured by the technique, and the understandings, adjustments, and decisions that can eventually follow. The article comments on the scales used at GRI with the adaptive profiles. | |||
=Normativity= | =Normativity= | ||
With assessment techniques, normativity refers to the ability of the technique to compare an individual's results to a larger population. Since the word normative also implies in sociology and organizations specific rules to follow, it’s important to note that “normativity” in assessment only pertains to how data is normalized, eventually using a | With assessment techniques, normativity refers to the ability of the technique to compare an individual's results to a larger population. Since the word normative also implies in sociology and organizations specific rules to follow, it’s important to note that “normativity” in assessment only pertains to how data is normalized, eventually using a standard deviation or quantile scale, to allow meaningful understanding of a score and comparisons with other scores. | ||
Normative assessments usually compare people based on gender, culture, age, or job type. For example, in medicine or with clinical assessments, different norms are used for different age groups or genders. Scales for adolescents differ from those for adults and seniors, which helps to improve diagnoses and prescriptions. While this approach is necessary in medicine and clinical settings, it is not suitable for work applications, creating inappropriate comparisons and bias. | Normative assessments usually compare people based on gender, culture, age, or job type. For example, in medicine or with clinical assessments, different norms are used for different age groups or genders. Scales for adolescents differ from those for adults and seniors, which helps to improve diagnoses and prescriptions. While this approach is necessary in medicine and clinical settings, it is not suitable for work applications, creating inappropriate comparisons and bias. | ||
=Ipastivity= | =Ipastivity= | ||
With assessment techniques, ipsativity refers to the comparisons made between two or more dimensions being measured, rather than comparing them to a larger group, such as what normative approaches do. Ipsativity is intrapersonal as it deals with various attributes of a single individual. The peculiar name “Ipsative” comes from the Latin word ipse, which means "of the self." Ipsative assessments typically ask questions requiring forced choices, such as True/False, Yes/No, or by ranking the attributes presented in order. | With assessment techniques, ipsativity refers to the comparisons made between two or more dimensions being measured, rather than comparing them to a larger group, such as what normative approaches do. Ipsativity is intrapersonal as it deals with various attributes of a single individual. The peculiar name “Ipsative” comes from the Latin word ipse, which means "of the self." Ipsative assessments typically ask questions requiring forced choices, such as True/False, Yes/No, or by ranking the attributes presented in order. | ||
| Line 19: | Line 22: | ||
=Typology Scale= | =Typology Scale= | ||
In a standard typology, the scale is very simple: you either have it or you don't. | In a standard typology, the scale is very simple: you either have it or you don't. “I am this with the characteristics coming with the type, but without any nuances that may fit my particular case". Standard types come with systems measuring if one is being a trailblazer, warrior, leader, activator, helper, reformer, enthusiast, peacemaker, arranger, relator, woo, maximizer, etc., or not. In statistics, a typology scale is called a nominal scale; It’s the most basic and least precise scale. | ||
Types are often presented as a dichotomy, such as “I am this” or “I am that”, an introvert or an extrovert, rich or poor, white or black, without any shades of gray, like in the illustration below. The two parts of the dichotomy are mutually exclusive, in a sharp contrast with one another. | Types are often presented as a dichotomy, such as “I am this” or “I am that”, an introvert or an extrovert, rich or poor, white or black, without any shades of gray, like in the illustration below. The two parts of the dichotomy are mutually exclusive, in a sharp contrast with one another. | ||
[[File:Typology Scale.png|center|300px]] | [[File:Typology Scale.png|center|300px]] | ||
With social behaviors, a dichotomy’s mean can vary, as the illustration below represents, including more or fewer people in a type, depending on whether the outcome needs to be balanced or unbalanced, but not necessarily reflecting one’s reality. As for the decile and value-based scales, one cannot know how multiple scores combine, but with even less accuracy. | With social behaviors, a dichotomy’s mean can vary, as the illustration below represents, including more or fewer people in a type, depending on whether the outcome needs to be balanced or unbalanced, but not necessarily reflecting one’s reality. As for the decile and value-based scales, one cannot know how multiple scores combine, but with even less accuracy. | ||
[[File:Typology Mean.png|center| | [[File:Typology Mean.png|center|500px]] | ||
Multiple | Multiple-typology scales, which rank dimensions in a specific order, are referred to by some systems as themes or strengths. In statistics, those scales that rank data are called ordinal. The challenges with ordinal scales when measuring social behavior are the same as with decile scales and value-based scales for comparing and representing how differently and intensely the dimensions may be expressed. The illustration below on the left represents a system where people are assigned to a type among four, then to its right, another system where types are ranked, and on the right, a third system that measures even more types and combines both systems. | ||
[[File:Multiple Typology Scales.png|center| | [[File:Multiple Typology Scales.png|center|650px]] | ||
Typologies are oversimplifications that offer shortcuts to categorize people. They are easy to understand, but also lead to inaccurate assumptions and to apply negative stereotyping, hiding important nuances of the dimension being measured. They cannot account for the adaptation and development of the behaviors being described. | Typologies are oversimplifications that offer shortcuts to categorize people. They are easy to understand, but also lead to inaccurate assumptions and to apply negative stereotyping, hiding important nuances of the dimension being measured. They cannot account for the adaptation and development of the behaviors being described. | ||
=Standard Scale= | =Standard Scale= | ||
A standard scale converts raw scores into a scale with a mean and standard deviation. A standard deviation is a deviation that is standard: it is the average of all deviations from the mean of the normal sample. With this scale, a score can better account for a dimension’s intensity. | A standard scale converts raw scores into a scale with a mean and standard deviation (SD, σ, or sigma). A standard deviation is a deviation that is standard: it is the average of all deviations from the mean of the normal sample. The normal distribution is often represented by a Gaussian distribution, as is shown below. With this scale, a score can better account for a dimension’s intensity. For social behaviors, it helps compare scores for the same individual, analyze how intense each dimension is, and how it influences the others. | ||
[[File:Normal Distribution.png|center|450px]] | [[File:Normal Distribution.png|center|450px]] | ||
=GRI Scale= | =GRI Scale= | ||
The GRI | The GRI scale combines the advantages of normative distributions and ipsativity, helping analyze how different factors relate to each other and to the larger population. This comes partly from the survey's free-choice format, which lets respondents select as many or as few adjectives as they like when answering the two questions. After scoring, the answers are compared to a larger population and ipsatized. | ||
Research shows, especially studies analyzing lexicons across different cultures, along with our findings at GRI, that some behavioral factors are universal. Normative measures are derived from a sample representative of the broader population, encompassing various genders, ages, political and religious beliefs, and cultural backgrounds. The mean, or any other point on the scale, can serve as a reference for comparison, but the mean is neutral and practical, which is why we use it at GRI. The standard deviation scale measures how far a score deviates from the mean. The amount of deviation in standard deviations provides a more precise understanding of the score's intensity and the likelihood of its occurrence than other scales. | |||
[[File:GRI Scale.png|center|450px]] | [[File:GRI Scale.png|center|450px]] | ||
Having a better account of a score’s intensity is important for understanding the efforts it takes to adapt a behavior, planning personal development, | Having a better account of a score’s intensity is important for understanding the efforts it takes to adapt a behavior, planning personal development, and also for making meaningful comparisons with the behaviors required in a job and between people. | ||
[[Category:Articles]] | |||
[[Category:Assessment]] | |||
Latest revision as of 17:10, 14 October 2025
Introduction
This article presents the normative and ipsative approaches used for measuring and comparing individual dimensions measured by assessment techniques. It also discusses the pros and cons of using decile, value-based, typology, and standard scales. The quality of the scale is critical for having a clear appreciation of a dimension’s intensity. It has important repercussions on the quality of the information being measured by the technique, and the understandings, adjustments, and decisions that can eventually follow. The article comments on the scales used at GRI with the adaptive profiles.
Normativity
With assessment techniques, normativity refers to the ability of the technique to compare an individual's results to a larger population. Since the word normative also implies in sociology and organizations specific rules to follow, it’s important to note that “normativity” in assessment only pertains to how data is normalized, eventually using a standard deviation or quantile scale, to allow meaningful understanding of a score and comparisons with other scores.
Normative assessments usually compare people based on gender, culture, age, or job type. For example, in medicine or with clinical assessments, different norms are used for different age groups or genders. Scales for adolescents differ from those for adults and seniors, which helps to improve diagnoses and prescriptions. While this approach is necessary in medicine and clinical settings, it is not suitable for work applications, creating inappropriate comparisons and bias.
Ipastivity
With assessment techniques, ipsativity refers to the comparisons made between two or more dimensions being measured, rather than comparing them to a larger group, such as what normative approaches do. Ipsativity is intrapersonal as it deals with various attributes of a single individual. The peculiar name “Ipsative” comes from the Latin word ipse, which means "of the self." Ipsative assessments typically ask questions requiring forced choices, such as True/False, Yes/No, or by ranking the attributes presented in order. With ipsative measures, we are dealing with "within-person" comparisons, rather than comparisons with other people, as is the case with normative measures. The results of the same person’s various attributes are compared with each other at one point in time, or an attribute’s value is compared with other values at different times.
Decile Scale
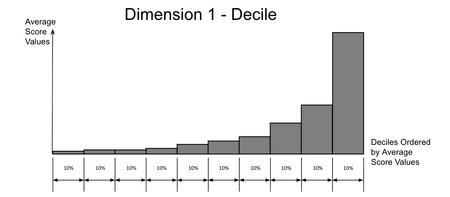
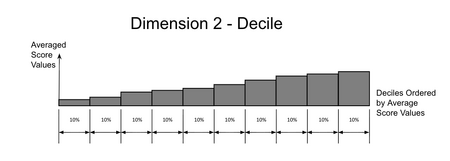
A decile scale is a type of scale that separates data into ten equal groups. A person's decile rank indicates which of these ten groups their score falls into, providing an understanding of the person’s score relative to a representative sample of a larger group (also called a normative group in statistics).
Percentile scales provide an even more precise granular view by dividing the scores into 100 equal groups. Decile or percentile scales help understand the intensity of an individual's score, including identifying if the score is at the bottom or top, compared to the larger group. However, as the figures below indicate, scores can be heavily skewed towards the lower or upper end. This will mislead the interpretations of the score’s distribution, particularly when comparing it with other scores, as often happens with social behavior dimensions.
Value-Based Scale
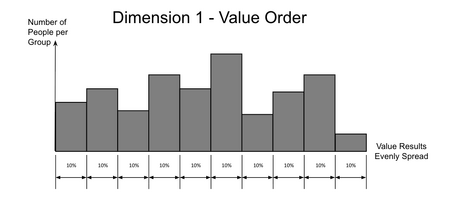
Scores may be ordered based on their values from low to high, between 0 and 10, as often happens with the measurement of personality dimensions. The value distribution may look like the one below, with a different number of people for each group of values. Like Decile scales, value-based scales mislead the understanding of a score's intensity. Values are never evenly distributed. Comparing scores, as it often happens with social behavior dimensions, misleads the analysis even further.

Typology Scale
In a standard typology, the scale is very simple: you either have it or you don't. “I am this with the characteristics coming with the type, but without any nuances that may fit my particular case". Standard types come with systems measuring if one is being a trailblazer, warrior, leader, activator, helper, reformer, enthusiast, peacemaker, arranger, relator, woo, maximizer, etc., or not. In statistics, a typology scale is called a nominal scale; It’s the most basic and least precise scale.
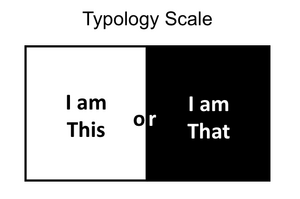
Types are often presented as a dichotomy, such as “I am this” or “I am that”, an introvert or an extrovert, rich or poor, white or black, without any shades of gray, like in the illustration below. The two parts of the dichotomy are mutually exclusive, in a sharp contrast with one another.
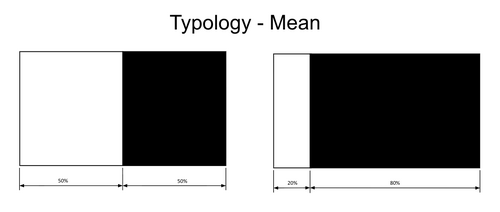
With social behaviors, a dichotomy’s mean can vary, as the illustration below represents, including more or fewer people in a type, depending on whether the outcome needs to be balanced or unbalanced, but not necessarily reflecting one’s reality. As for the decile and value-based scales, one cannot know how multiple scores combine, but with even less accuracy.
Multiple-typology scales, which rank dimensions in a specific order, are referred to by some systems as themes or strengths. In statistics, those scales that rank data are called ordinal. The challenges with ordinal scales when measuring social behavior are the same as with decile scales and value-based scales for comparing and representing how differently and intensely the dimensions may be expressed. The illustration below on the left represents a system where people are assigned to a type among four, then to its right, another system where types are ranked, and on the right, a third system that measures even more types and combines both systems.
Typologies are oversimplifications that offer shortcuts to categorize people. They are easy to understand, but also lead to inaccurate assumptions and to apply negative stereotyping, hiding important nuances of the dimension being measured. They cannot account for the adaptation and development of the behaviors being described.
Standard Scale
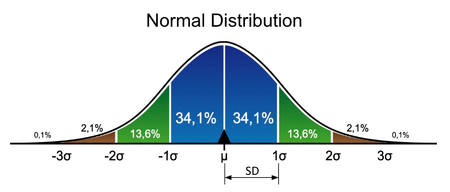
A standard scale converts raw scores into a scale with a mean and standard deviation (SD, σ, or sigma). A standard deviation is a deviation that is standard: it is the average of all deviations from the mean of the normal sample. The normal distribution is often represented by a Gaussian distribution, as is shown below. With this scale, a score can better account for a dimension’s intensity. For social behaviors, it helps compare scores for the same individual, analyze how intense each dimension is, and how it influences the others.
GRI Scale
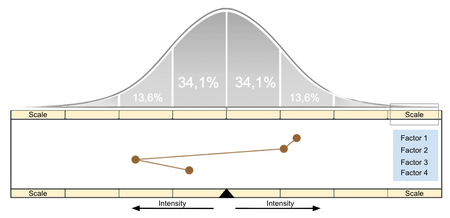
The GRI scale combines the advantages of normative distributions and ipsativity, helping analyze how different factors relate to each other and to the larger population. This comes partly from the survey's free-choice format, which lets respondents select as many or as few adjectives as they like when answering the two questions. After scoring, the answers are compared to a larger population and ipsatized.
Research shows, especially studies analyzing lexicons across different cultures, along with our findings at GRI, that some behavioral factors are universal. Normative measures are derived from a sample representative of the broader population, encompassing various genders, ages, political and religious beliefs, and cultural backgrounds. The mean, or any other point on the scale, can serve as a reference for comparison, but the mean is neutral and practical, which is why we use it at GRI. The standard deviation scale measures how far a score deviates from the mean. The amount of deviation in standard deviations provides a more precise understanding of the score's intensity and the likelihood of its occurrence than other scales.
Having a better account of a score’s intensity is important for understanding the efforts it takes to adapt a behavior, planning personal development, and also for making meaningful comparisons with the behaviors required in a job and between people.

