Language and Signs: Difference between revisions
| Line 61: | Line 61: | ||
==Multiple-Typologies== | ==Multiple-Typologies== | ||
[[File:Multiple Typologies.png|right|180px]] | [[File:Multiple Typologies.png|right|180px]] | ||
With multiple typologies, several types — also called themes by some techniques — are ranked by order of intensity. For instance, CliftonStrength measures 34 themes, regrouped into four domains, and lists the five most characteristic themes. Those representations, by construction, present challenges similar to those of typologies, as they don’t evidence the intensity of each dimension with nuances along continuums. | With multiple typologies, several types — also called themes by some techniques — are ranked by order of intensity. For instance, the CliftonStrength measures 34 themes, regrouped into four domains, and lists the five most characteristic themes. Those representations, by construction, present challenges similar to those of typologies, as they don’t evidence the intensity of each dimension with nuances along continuums. | ||
Ranking is used when a larger number of typologies are calculated, thus helping to focus on the most significant ones. As noted above for bar graphs and typologies, social behavior is both relatively stable and adaptable to some degree, and these aspects cannot be captured by multiple typologies and their representations, thereby limiting their applicability. The themes' condensed nature, however, is easy to learn, contrast, understand, and use, even though their measurement quality may be misleading. | Ranking is used when a larger number of typologies are calculated, thus helping to focus on the most significant ones. As noted above for bar graphs and typologies, social behavior is both relatively stable and adaptable to some degree, and these aspects cannot be captured by multiple typologies and their representations, thereby limiting their applicability. The themes' condensed nature, however, is easy to learn, contrast, understand, and use, even though their measurement quality may be misleading. | ||
Revision as of 23:53, 12 November 2025
Introduction
As the study of assessment techniques progressed over the past decades, it has become clearer that their effectiveness depends on the quality of their metrics — not just the value of the measures themselves, but also how concisely and accurately they represent the object they intend to measure.
The measures produced by assessment techniques can be analyzed as signs with the syntactic, semantic, or pragmatic approaches that have long been employed in other fields such as mathematics and physics. The quality of the signs significantly influences how they can be learned, retained, and used alongside other information. The representation can either restrict or limit the use of the measures, or, alternatively, add value and facilitate their use. Their validity and utility depend on it.
In both syntactic and semantic approaches, signs are combined into sequences according to specific rules. The sign is examined based on what it represents, independent of its physical form (the signifier) and the meaning or idea it conveys (the signified). But syntactic and semantic analysis primarily applies to linguistic expressions such as words, phrases, and sentences. The scope of semiotics, the science of signs, is broader than language alone. Analyzed from a pragmatic standpoint, signs from assessment techniques involve guiding principles, beliefs, and the strength of inferences, which are essential to understanding decision-making and communication.
After an introduction to the signs, this article discusses the three instances of a sign as they apply to assessment techniques: the object, the facts and actions they indicate, and the rules taken by signs. It then presents seven different representations of assessment techniques' measures, before discussing how meaning grows on adaptive profiles.
Fundamentals of Semiotics
Basically, everything that we can perceive and think about is a sign. A sign can be a musical note, the signs “+” or “$”, “50°F” to indicate temperature, a publicly displayed placard to advertise, any word, or text. The definition of sign: “an object, quality, or event whose presence or occurrence indicates the probable presence or occurrence of something else” can only be broad.
Signs have three fundamental modes of existence: how they show, what they indicate, and the rules they imply. In semiotics, they are called First, Second, and Third elements.
For instance, for temperature, its measure is represented by a number on a continuous scale followed by a unit (degrees Celsius or Fahrenheit), such as 50°F. This representation indicates how extremely, very, or moderately cold or hot the temperature may be. Depending on the situation, we can infer how to dress, turn the room's temperature knob up or down, or, if it's our own, take medication if it's too high.
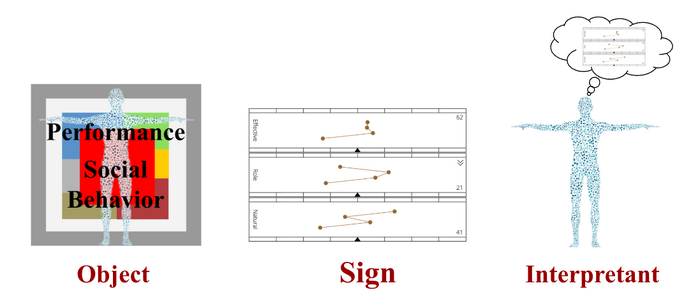
Although the number and quality of variables related to people in organizations are greater and more complex, the principles are the same as for temperature. For individual characteristics, measures appear in many different ways, pointing to very different outcomes, and leading to many different uses. With the adaptive profiles as signs, the object is individual performance and social behavior, and the interpretants are the organization’s stakeholders.
Once trained, the users of the adaptive profiles (interpretants) combine the visual and linguistic attributes of the signs that represent performance and social behavior (the object) with other characteristics, helping with decision-making, self- and social-awareness, skills development, interactions, and other managerial actions involving people and their organizations. This process illustrates the semiotics' concept of semiosis — the process of creating meaning through signs and inferences.
Quality of Signs
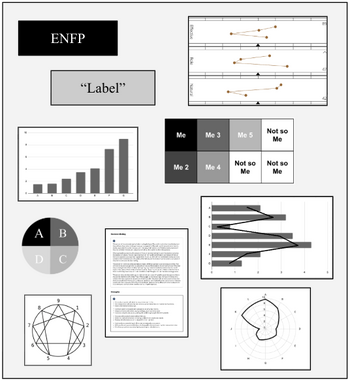
Results from assessment techniques can take many forms, such as bar graphs, diagrams, and spider charts. Some techniques produce written reports of one or more pages. Others produce notations on traits and factors, with labels and values. Still others produce four-letter codes, such as ISTJ or ENFP, as with the Myers-Briggs Type Indicator (MBTI). In all cases, the tangible element of the sign — what it is — is its first component.
The visual aspect of the measure as a sign, how it integrates with other characteristics and techniques, predisposes or restricts its use. The quality of what is measured is one thing; the representation of the measure is another. The two combined tell how the measure can be learned, used, and by whom. It also informs about the inherent limitations and restrictions of the results, what can be done with them, and who their potential users can be.
Indicating Facts and Action
The second element of signs is what they indicate: something, a fact, an event, an occurrence, or an action. In the case of GRI, the adaptive profile indicates social behavior—not skills, values, abilities, intelligence, experience, or interests—but the core aspect of personality that informs how people act, think, and feel. Not living in a vacuum, it also tells how individuals perform, adapt, and engage in their environment. Other systems indicate a trait, a type, or another individual characteristic, along with the limitations inherent in what the sign points to.
Assessment measures can be categorized based on whether they reflect qualities or actions. This distinction is crucial for understanding organizations where action plays a key role in social interactions, group dynamics, and value creation. Measures can refer to a quality, such as a skill in computer science. Others can directly indicate how people behave and perform. This makes them different because they can represent both individual and collective actions. In this case, there is no causal link between the sign and the action; the sign represents the action along with its associated effects.
If we compare a sign of action to a territory, the territory to which the signs refer is the dynamic action itself and not a territory of qualities. The use of signs as indicators of action allows one to emphasize the action itself rather than the historical reasons and other cognitive, physiological, or social causes that may have led to it. The sign itself can be used to describe individual and social realities from a social-behavioral standpoint. As discussed earlier, the sign's quality will determine the action taken. For example, with GRI’s adaptive profile, the representation includes information on adaptation and engagement, suggesting additional steps the interpreter should take to enhance performance. It also indicates how to achieve this for the person whose sign or measure it is.
Rules Taken by Signs
The third component of signs is the rules, logic, and experiences gained with them. Those rules stem from the sign's indication (Second element) and its quality (First element).
In the context of people and their organizations, the rules built on signs correspond to what should be done in a "particular situation" due to a "specific characteristic" resulting from a "certain technique". These rules refer to options that are possible or to be avoided and are generally communicated by the technique’s publisher. They are contained in manuals or presented by facilitators during training. They correspond to the theoretical model underlying the assessment technique.
Manuals' content varies, also constrained by the quality of the sign. Some manuals explain how the assessment was built and provide statistics, but are not explicit about practical aspects of its use, such as how to use the results in recruitment or organizational development. Other manuals are more explicit about their use, but say little or nothing about the metric’s construction and its statistics. Still other techniques provide minimal information or none and simply defer to the theory on which they are built, with sometimes no real connection between the two, or only to the users' implicit theories, as when the measures boil down to labels and their values.
Signs Produced by Assessment Techniques
How assessment techniques' results display tells a lot about their metrics’ quality and potential utility. The scales that are displayed, whether categorical or continuous, have a major impact on how the measures are learned and used. The visual’s colors are also important to make the sign more attractive and memorable. In the presentation below, the colors were abstracted to focus on the sign's other qualities. The analysis mostly applies to social behavior and may also extend to other characteristics.
Bar Graphs
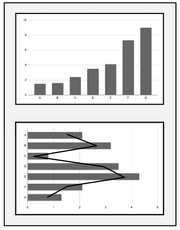
Bar graphs typically display the dimensions side by side. For instance, the Limra system calculates 14 traits, regroups them into three categories, and displays a bar graph for each trait. The representation of bar graphs may be vertical, horizontal, and with lines at the extremities of the bars, but most often not. Sometimes the measures show as histograms, without space between bars. In all cases, this representation accounts for continuous measurement of dimensions on quantile scales, most often deciles (ten parts), and sometimes quintiles (5 parts).
The limitation of this representation is that it cannot account for the overlap among the measured dimensions. The dimensions look distinct; they are not.
Compared to standard deviation scales, quantile scales distort the reading of the dimension’s intensity and mislead comparisons between dimensions. For personal development applications, the measures may serve as broad indicators but cannot account for the energy required to develop those dimensions or the emotional resistance that may come along. Typologies are easier to understand and are generally much preferred for this application (see below). Measures from bar graphs are also typically used in recruitment to provide indications about personal dimensions that can then be compared with those from job descriptions. However, the lack of precision limits their use beyond recruitment.
Typologies
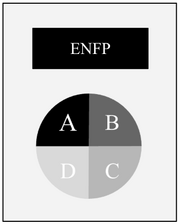
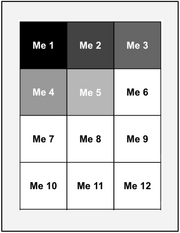
Typologies represent dimensions in categories. For instance, the Myers-Briggs Typology Indicator (MBTI) produces a four-letter code, such as ENFP. The combination of the four letters yields 16 types, within which MBTI locates people's social behaviors. Other systems represent the measures in circles or squares with a variable number of dimensions, which, over time, tends to be below five. The Enneagram’s measures (see below), with its nine dimensions, may also fall under this typology’s representation, except for its spider-chart look and feel.
The dimensions and letters in the categories strictly combine types that have no intrinsic nuance by construction. Categorial measures have no intensity. Some nuances arise when combining the other types, but without intensity, there is no way to account for how much each one really influences the others. With systems that calculate types from continuous scales and thus have an indication of the intensity, the representation fails to account for it.
As evidenced by adaptive profiles, social behavior has intensity and can be represented with nuance along continuums (see below), something that typologies cannot do by construction. Additionally, social behavior is both relatively stable and adaptable to some degree. Those aspects cannot be represented using a typology, thus limiting their utility. Typologies are commonly used for coaching and team building; they are easy to understand, but their representations limit their use to these applications. Their general validity and utility for any other applications are low.
Multiple-Typologies
With multiple typologies, several types — also called themes by some techniques — are ranked by order of intensity. For instance, the CliftonStrength measures 34 themes, regrouped into four domains, and lists the five most characteristic themes. Those representations, by construction, present challenges similar to those of typologies, as they don’t evidence the intensity of each dimension with nuances along continuums.
Ranking is used when a larger number of typologies are calculated, thus helping to focus on the most significant ones. As noted above for bar graphs and typologies, social behavior is both relatively stable and adaptable to some degree, and these aspects cannot be captured by multiple typologies and their representations, thereby limiting their applicability. The themes' condensed nature, however, is easy to learn, contrast, understand, and use, even though their measurement quality may be misleading.
As for typologies, although the dimensions may often be work-related, multiple typologies are rarely used in recruitment but are “silently” used for promotion once the measure has been made available in other applications. It’s also common practice in some organizations to have multiple-typology assessments administered alongside engagement surveys, thereby systematizing the collection of multiple-typology measures across the entire organization. The resulting analyses at the organizational level remain constrained by the quality and representation of the metrics.
Spider Charts
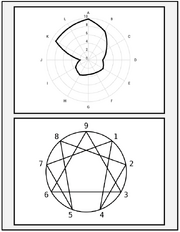
The representation, in the form of spider or radar charts that use a central point from which multiple axes (spokes) radiate, each representing a different characteristic, limit the measures to two sides, usually with the null value on one side and 9 or 10 values on the other. The limitations do not occur when the dimensions are measured with standard deviation scales that extend on either side, without such restrictions. Although measures presented on a spider chart are concentrated, which eases their reading, comparisons between the dimensions are difficult, especially when one dimension is on the other side of the chart, as is the case with the Enneagram.
The measures’ limitations are the same as for bar graphs, although the representation in a spider chart is different. The figure of the Enneagram, whose representation is close to a spider chart: in this representation, the values appear only on the outer circle; the measures’ limitations are closer to those of typologies and multiple-typologies (see above).
Applications are similar to those evidenced for bar graphs, typologies, and multiple typologies, often in personal development and team building, more rarely in recruitment, informally for promotion, and sometimes in clinical applications to assist therapists in understanding their patients. The nature of spider charts allows for the inclusion of multiple individual results at the organizational level. However, similarly to multiple typologies, analyses are constrained by the quality and representation of the metrics.
Labels
A label is any concept, represented by a word or expression, that may also come by itself without any other dimensions. For instance, “creativity”, “entrepreneurship”, and “strategic thinking” are measured with their author's understanding of these concepts. A synthetic text or booklet can define what the author had in mind. Nevertheless, “creativity”, “entrepreneurship”, and “strategic thinking” have an existence and meanings beyond what the technique and its author can tell. Additionally, a concept may have different connotations and be expressed in different ways, not only depending on the person being assessed but also on the context.
The use of the "label" depends on its end users as well, also called the "interpretant" in semiotics. The interpretant rules remain singular and may be distant from those of the assessment's author. In practice, with labels used in common language, interpretants already have some understanding, beliefs, and rules on “creativity”, “entrepreneurship”, and “strategic thinking.” They may use the assessment to test their private technique. Measures may eventually challenge the interpretant or reinforce their conviction.
When a dimension is clinical as in "neuroticism" and "bi-polarity," this forces the user to rely on a clinical expert for interpretation. This doesn't happen when the dimensions and labels are in the realm of "normal" social behavior.
The assessment ultimately leaves the interpretant with their own private understanding, definitions, and rules, although the technique may identify and disqualify those with extremely low scores, which may be their only utility for personal and organizational applications.
Reports
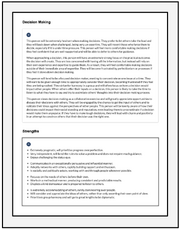
Reports offer another arrangement of nuances, though less concise than those from diagrams, charts, and bar graphs. They are subject to the same common-sense limitation described above for labels. The narratives are typically repetitive, hard to memorize. When written solely on the basis of personality assessments, they are all the more suspicious, as they provide generalizations and explanations on dimensions they don't assess.
Each sentence is a fragmental interpretation of the dimensions being measured or should be, although the tendency for reports is to make suppositions beyond the capacity of what’s measured. Only repeated observations can reveal whether the narrative statements are valid, which is not possible without knowing in the report which dimension they're coming from.
When comparing with the adaptive profiles, statements of reports show as either neutral, imprecise, and misleading, or valid, but the three are mixed together. When an analysis focuses on organizational needs, recruitments, and job fit, rather than purely on the individual, the relationships between the person and the context are hard to analyze and impossible to quantify. That’s a major limitation when using reports for these applications.
Adaptive Profiles
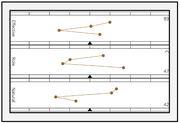
In GRI’s adaptive profile, the signs are reduced into profiles (Natural, Role, Effective), scales (Standard deviation), factors (1, 2, 3, 4), factor interactions (connections between factors), arrows (engagement level), and numbers (response levels) as it is illustrated here.
The adaptive profile as a sign indicates performance and social behavior. The two aspects together help diagnose and provide solutions to improve individual and organizational performance. They require learning the signs and their related new representations, language, and rules — the three components of the sign. They provide information on how characteristics other than social behavior develop and are expressed. Some social behaviors are more desirable in certain jobs than others; lack of engagement (as measured and indicated) consumes energy. All these rules, and many others, stem from repeated tests and observations accumulated over years of using the adaptive profiles.
Learning new rules of social behavior associated with new signs, such as adaptive profiles, occurs through training, interaction, and facilitation. It requires practice, in real, individual cases involving people participants know. By simultaneously practicing, testing, and validating, signs begin to acquire meaning and utility for their interpretant. The same learning patterns can be seen in signs from other techniques, although with limitations inherent to the quality of those signs, which, as noted above, restrict their use to what is already known about the concepts being measured, or to a few expert users and for narrow applications.
Building New Effective Meaning
The benefits of an assessment technique when used at a strategic level largely come from the quality of the signs being measured and their capacity to be learned and guide action at that level.
A sign concentrates meaning, which can then serve as the basis for new, more effective guiding principles to be shared within the organization. Through the symbol, the representations and arguments conveyed can benefit from new experiences, discussions, and refutations, something that private techniques can’t do. Private techniques are everyone's semiotic process, remain subjective, and are not shared. Common and esoteric techniques are open to refutation; that’s probably why they rarely survive the test of time for organizational applications.
The measures typically provided by assessment techniques relate to concepts that are available and used in common language, validating or refining a user’s concept but without conferring new symbolic or argumentative value. The same applies to the adjectives and expressions that characterize organizational action: communication, extroversion, initiative, etc.. Without new representations, meaning, and rules that can carry more value for the organization, and without appropriation by their interpreter, the measures rely only on the interpreters’ private understanding and rules.
The logic of signs applies not only to individual characteristics but also to the techniques that measure them — formal, semi-formal, and statistics-based techniques — for understanding their use in organizations. An assessment technique can potentially exist without being used. Its use may cover qualities and rules specific to the organization and vary from person to person. Their sign values help compare them, the characteristics they measure, and what the organization and individual users can do with them to improve performance.

