Adaptation: Difference between revisions
(Created page with "right|350px =Introduction= The Role profile–the graph in the middle of the adaptive profile—portrays how a person perceives the need to adapt. The more different the Role profile is to the Natural (the graph at the bottom), the greater the perceived need for adaptation. Consequently, the Effective behavior (the graph on the top, as in Figure 2) will be different. The arrows and numbers on the right indicate how the person feels eng...") |
mNo edit summary |
||
| Line 19: | Line 19: | ||
=Personal Efficacy= | =Personal Efficacy= | ||
In the examples below in Figure 11, the three graphs are aligned. The perceived role is in phase with the natural behaviors. Consequently, the behaviors of the Effective are aligned too. | In the examples below in Figure 11, the three graphs are aligned. The perceived role is in phase with the natural behaviors. Consequently, the behaviors of the Effective are aligned too. | ||
[[File:Adpatation Same.png|center|350px]] | |||
<center>Profile Corresponding to Personal Effectiveness.</center> | <center>Profile Corresponding to Personal Effectiveness.</center> | ||
| Line 31: | Line 31: | ||
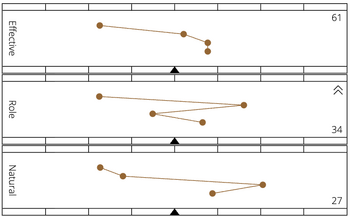
A wide profile with an inverted Role, as in Figure 12, creates frustration and burnout and will cause the person to leave the position. These situations come with a reduction in self-confidence, well-being, and productivity. | A wide profile with an inverted Role, as in Figure 12, creates frustration and burnout and will cause the person to leave the position. These situations come with a reduction in self-confidence, well-being, and productivity. | ||
[[File:Adaptation Different.png|center|350px]] | |||
<center>Inversion of the Role and Natural.</center> | <center>Inversion of the Role and Natural.</center> | ||
| Line 39: | Line 40: | ||
The arrows pointing up indicate stimulation, engagement, involvement, and commitment. Conversely, the arrows pointing down indicate demotivation, disengagement, and lack of productivity. Figure 13 below shows examples of very low and very high engagement. | The arrows pointing up indicate stimulation, engagement, involvement, and commitment. Conversely, the arrows pointing down indicate demotivation, disengagement, and lack of productivity. Figure 13 below shows examples of very low and very high engagement. | ||
<center>[[File:Adaptation Disengaged.png|350px]] [[File:Adaptation Engaged.png|350px]]</center> | |||
<center>Very Low Engagement (left) vs Very High Engagement (right).</center> | <center>Very Low Engagement (left) vs Very High Engagement (right).</center> | ||
Revision as of 00:10, 21 September 2025
Introduction
The Role profile–the graph in the middle of the adaptive profile—portrays how a person perceives the need to adapt. The more different the Role profile is to the Natural (the graph at the bottom), the greater the perceived need for adaptation. Consequently, the Effective behavior (the graph on the top, as in Figure 2) will be different. The arrows and numbers on the right indicate how the person feels engaged in their environment. Those aspects are presented below.
Generalities
The conceptualization of the Role concurs with the dynamic model of personality elaborated by Mischel and Shoda (1995, 2008). Adaptation can also be approached by the observations of organizations from Likert (1967), Riesman, Glazer & Denney (1950). In sociology, the Role can be analyzed by symbolic interactionism and functional perspectives.
With symbolic interactionism (Mead, 1934), the individual interacts with the environment through their cognitive and symbolic faculties. They adapt their natural behaviors to the environment as they perceive it.
From the functionalist perspective, a person's social role influences their mode of action. What is expected of the person and how they integrate it determines their social behavior (Parsons & Shils, 2001 [1951]). The Role graph portrays the behavior that the person perceives to act out. This behavior may differ from the one expected by the environment.
The perceived adaptation portrayed in the Role can be circumstantial, reflecting temporary efforts, or structural when the required efforts are prolonged. Adaptation results from the environment's or person's insistence on adapting behaviors over time.
Three aspects of the Role are described below:
- (1) Personal efficacy when the three graphs have shapes close to each other,
- (2) Adaptation when the shapes of the Natural and Role are different, and
- (3) Engagement, where the arrows to the right of the Role point up or down.
Personal Efficacy
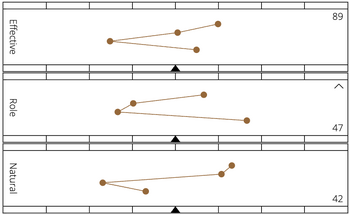
In the examples below in Figure 11, the three graphs are aligned. The perceived role is in phase with the natural behaviors. Consequently, the behaviors of the Effective are aligned too.
In these situations, the person adopts behaviors that are in sync with their natural way of behaving; they are at flow.
The concept of adaptation, as it is evidenced in the Role profile, concurs with the observations of self-efficacy. Self-efficacy refers to the person mastering and controlling their environment (Bandura, 1986) and also mastering their belief about their own skills (Eden & Kinnar, 1991; Judge, Bono & Locke, 2000). Self-efficacy[3], which is considered a stable disposition and highly resistant to change (Perrewé & Spector, 2002) is associated with more job satisfaction through its impact on self-evaluation (Judge, Bono & Locke, 2000), less burnout (Perrewé & Spector, 2002) and higher performance (Quinn, 2000).
Adaptation
The more different the shapes of the Natural and Role profiles, the greater the pressure from the person or the environment—to adapt. Significant discrepancies between the Natural and the Role come along with what has been described in the literature as emotional fatigue, a feeling of depersonalization, and less accomplishment (Zellars, Perrewé & Hochwarter, 1999), abusive, aggressive behaviors (Fox, Spector & Miles, 2001) or psychological pressures of depression (Fortunado, Jeix & Heinish, 1999) or a lack of sleep and gastric problems (Parkes, 1999).
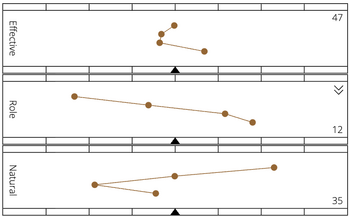
A wide profile with an inverted Role, as in Figure 12, creates frustration and burnout and will cause the person to leave the position. These situations come with a reduction in self-confidence, well-being, and productivity.
Engagement
A difference in response levels (the three numbers on the right of the profiles) between the Natural and the Role reflects whether the environment stimulates the person, and they consequently feel engaged (arrows pointing up) or the opposite, disengaged (arrows pointing down). This measure comes from the different levels of responses given to the two questions.
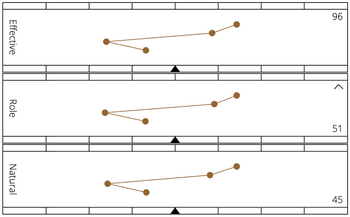
The arrows pointing up indicate stimulation, engagement, involvement, and commitment. Conversely, the arrows pointing down indicate demotivation, disengagement, and lack of productivity. Figure 13 below shows examples of very low and very high engagement.
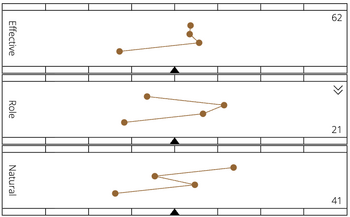
This dimension of engagement can be approached by the opposite of Self-efficacy (Bandura, 1997) or negative affectivity when the engagement is low and combined with a low adaptation (see below).
When a single arrow points down, this reflects low engagement. With two arrows, it reflects high dissatisfaction (Cavanaugh & al., 2000; De Jonge & al., 2001), frustration (Chen & Spector, 1991), or an intention to leave work (Van Katwyk & al., 2000). They may be associated with a lack of environmental support (Moyle, 1995).

